
In a past article we discussed running an internet speed test from the Linux command line. That is great for testing your internet speeds. But, what if you wanted to monitor the bandwidth usage of an internal connection? Enter bmon, a light weight real-time command line bandwidth monitoring tool.
The bmon utility is a tool that provides network interface utilization information on the command line, but in a very familiar way. The bmon utility is widely available, simple to install, and easy to get started. Let’s dive in.
Table of Contents
Installing BMON on Linux
Most modern Linux systems provide the bmon package in their default repositories. You can use your package manager to install it.
Fedora / CentOS 8 / Red Hat 8 Installation of bmon
You can use the dnf package manager to install the bmon utility with the following command:
sudo dnf install bmonNOTE: For Red Hat 8 and CentOS 8 you will need to install and enable the EPEL repository before installing bmon.
Red Hat 7 / CentOS 7 Installation of bmon
The Base repositories in CentOS and Red Hat 7 do not provide the bmon package. However, you can enable the epel repo and then install using yum. Use the following command to install the bmon utility via yum:
sudo yum install bmonUbuntu / Mint / Debian Installation of bmon
The apt package manager to install bmon on Debian based systems.
sudo apt install bmonUnderstanding the BMON Interface
The easiest way to use this utility is to invoke it without any options. It will automatically start monitoring active interfaces. In the animation below you can see how the bmon interface looks with all display panes toggled on. Let’s examine what is in each of the information panes.
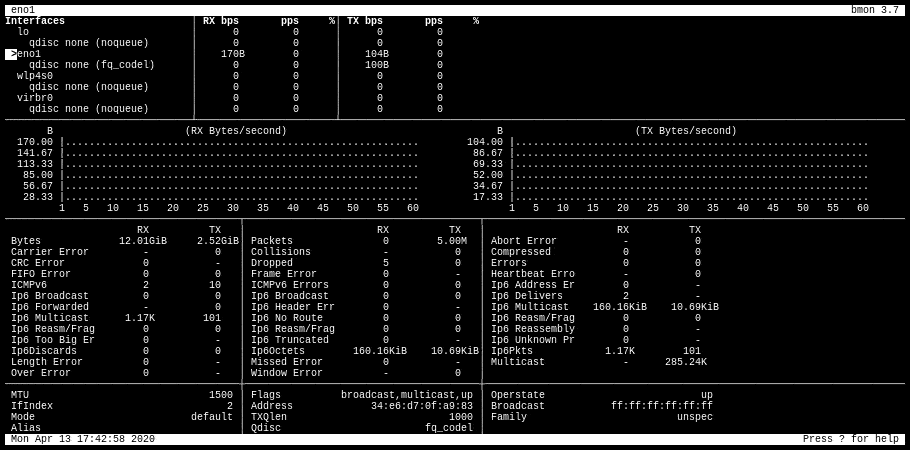
In this view you there are several rows (panes) of data.
1st row: This is the element list which shows all the interfaces that you can monitor and their current RX/TX utilization. You can use the up and down arrows to navigate to the desired interface.
2nd row: A graphical representation of the interface attributes. By default it shows the RX (received) and TX (transmitted) packets. The graphs can be toggled on or off by hitting g. Additionally, you can use the left and right arrows to toggle the attribute to be displayed.
3rd row: The detailed statistics pane. It shows you all the detailed information your system keeps on the selected network interface. You can toggle the detailed statistics by hitting the d key.
4th row: This is the additional information pane and shows you some more information about the configuration of the interface. You can toggle this on or off by hitting the i key.
At any time you can hit the ? to bring up the quick reference (seen below).
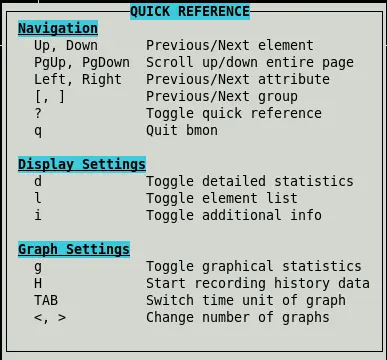
To exit the interface you can hit the q key.
Using BMON Options
There are several options and input/output modules that really make bmon a robust bandwidth monitoring utility. In this section we will outline some of the most common options.
Use Specific Interface at Start Up
You most likely want to monitor a specific interface when you open the utility. Instead of toggling through to find the interface you want, you can use the -p option and specify it on the command line. Here we are telling bmon to monitor the eno1 interface.
bmon -p eno1Set User Defined Read Interval
The default update, or read, interval is one second. You can change this to whatever you desire. Simply pass the -r switch followed by the desired interval in seconds. For example, to use a five second read interval, the command would look like this:
bmon -r 5You can decimal representations for half intervals or intervals less than a second. For example, use .5 to update the interface every half second.
Set User Defined Rate Interval
The rate interval is the time period in seconds taken into account for the rate calculations. The default value is 30 seconds. You can set a custom rate interval by using the -R option like so:
bmon -R 10Show All, Including Disabled, Interfaces
Using the -a option will show all elements (interfaces), including those that are disabled.
bmon -aUsing BMON Input and Output Modules
The bmon utility comes with several pre-configured input and output modules.
Listing Available Modules
You can list the available modules by calling the -i (input) and -o (output) options followed by the list argument.
[savona@putor ~]$ bmon -i list
input modules:
	netlink
	null
	dummy
	proc
[savona@putor ~]$ bmon -o list
output modules:
	null
	format
	ascii
	curses
Modules Descriptions
Here is a brief description of each module.
Input Modules
- netlink – Provides stats about traffic control qdiscs and classes.
- proc – Provides stats using the proc filesystem.
- dummy – Generates static or randomized input for testing purposes.
- null – Provides no stats / disable interface collection
Output Modules
- curses – Default view as seen above
- ascii – Prints highly configurable diagrams and lists to standard output.
- format – Provides ability to format ascii output for scripting.
- null – Disables primary output
For more in-depth information, please use the links in the resources section.
Specifying Input Modules
To select an input module you can issue the -i option followed by the desired module name. For example to use the proc input module:
bmon -i procSpecifying Output Modules
Conversely, to specify a desired output module you can use the -o option. Here is an example using the ascii output module.
bmon -o asciiConclusion
Bmon is a very powerful bandwidth monitoring tool. It has many options and configurations that are outside the scope of this tutorial. If you are interested in advanced usage of bmon, we suggest you read the detailed man pages and documentation available on it’s Github project page.
I tryed the install procedures for CentOS 8 but it doesn’t regognize BMON or bmon. The github link appears to not support this project any longer.
You are correct, it is not in the base repositories. I just checked my CentOS 8 development server and I had to install EPEL first, then bmon was available. See the quick instructions here:
https://www.putorius.net/how-to-enable-epel.html
The article was updated to reflect this. Thank you!
Unfortunately bmon seems to be missing even from EPEL now 🙁
Package epel-release-8-9.el8.noarch is already installed.
[root@server ~]# dnf install bmon
Last metadata expiration check: 0:10:16 ago on Tue 24 Nov 2020 01:04:26 PM EET.
No match for argument: bmon
It is still available from the official Fedora Epel 7:
https://dl.fedoraproject.org/pub/epel/7/x86_64/Packages/b/
I do not see it included in epel 8. If I have time I will look into the best way to install bmon if you are using CetnOS 8. Unless you want to share your ideas?